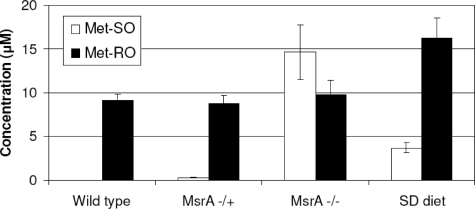
FIGURE 7.
Analysis of Met-SO and Met-RO in mouse plasma. Concentrations of Met-SO and Met-RO were determined in plasma of wild type, heterozygous MsrA knock-out (+/-), homozygous MsrA knock-out (-/-), and selenium-deficient (SD) mice. The error bars represent the standard deviations from four independent experiments.

