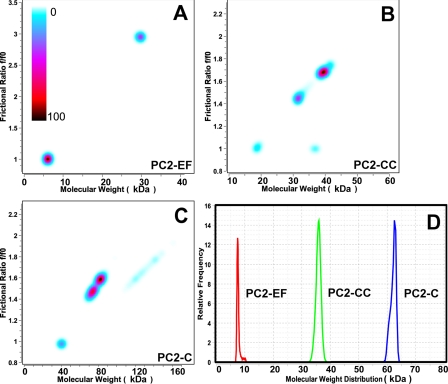
FIGURE 6.
Velocity sedimentation analysis indicates PC2-CC mediates oligomerization of PC2-C and has an elongated molecular shape. Velocity data were analyzed with 2DSA combined with Monte Carlo analysis (A–C), and results are shown in pseudo-three-dimensional plots versus frictional coefficient (f/f0). f/f0 >1.0 indicate an extended molecular shape. The relative concentration of solutes is shown using a color gradient (light blue to black with black centered peaks corresponding to the highest concentration). A, PC2-EF exists as a monomer with globular shape. B, PC2-CC is present as an elongated oligomeric species (trimer or tetramer). C, PC2-C appears to be elongated and present in a monomer-dimer equilibrium. D, van Holde-Weischet differential sedimentation distributions plotted as molecular weight distributions. All proteins appear narrowly distributed in the sedimentation coefficient.

