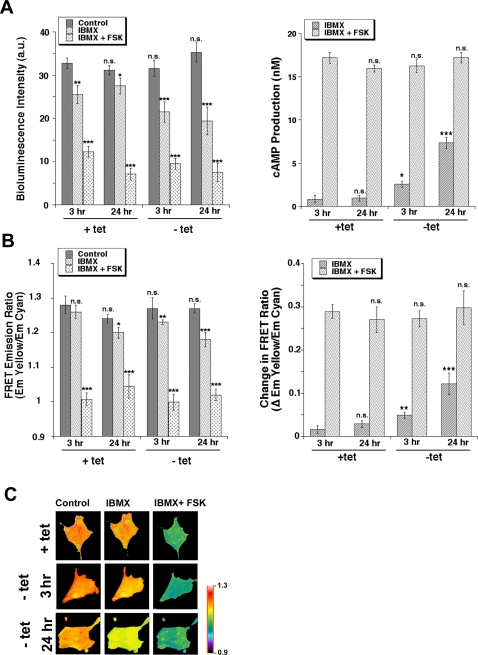
Figure 3. HPV16 E7 expression stimulates cAMP generation in 2BN11 cells.
To determine the effect of E7 expression on cAMP production, cAMP levels were measured using A. the biochemical luciferase-based Kinase-Glo System where luminescence is inversely proportional to cAMP levels (for details see Methods). Cells were cultured with or without tet for either 3 or 24 hr and then either not treated (dark bars) or treated for 30 min with either 100 µM IBMX (light bars) or 100 µM IBMX plus 20 µM FSK (stippled bars). Left panel shows levels of luminescence in the various treatments while right panel shows the calculated increase in cAMP concentration with each treatment. Error bars represent the standard error of the mean (SEM) of three independent experiments. B. Time-lapse FRET imaging in live cells transfected with a PKA-based FRET probe, in which cyan and yellow mutants of GFP have been fused to its regulatory and catalytic subunits, respectively, so that cAMP-induced dissociation between the two is detected as FRET changes. Cells were transfected with the FRET cAMP biosensor for 24 hrs and then cultured with or without tet for either 3 or 24 hr. Cells were mounted in a perfusion chamber and the FRET ratio measured during superfusion with ringer alone followed by superfusion first with 100 µM IBMX and then 100 µM IBMX plus 20 µM FSK. Cells were imaged for CFP and YFP every 20 s and the YFP/CFP emission ratios (FRET ratios) obtained. Left panel shows levels of YFP/CFP emission ratios in the various treatments while right panel shows the calculated increase in YFP/CFP emission ratios with each treatment which is relative to increases in cAMP production. Data are the mean±SEM from 32 different cells. C. Pseudocolor images representing YFP/CFP emission ratios recorded under control conditions (plus and minus tet for either 3 or 24 hrs), after exposure to 100 µM IBMX and after stimulation with IBMX (100 µM) plus FSK (20 µM). Each image was scaled according to its high and low values at each time point to show relative level of cAMP at each time point. The dynamic range was 0.9–1.3. Warmer colors correspond to lower cAMP levels.

