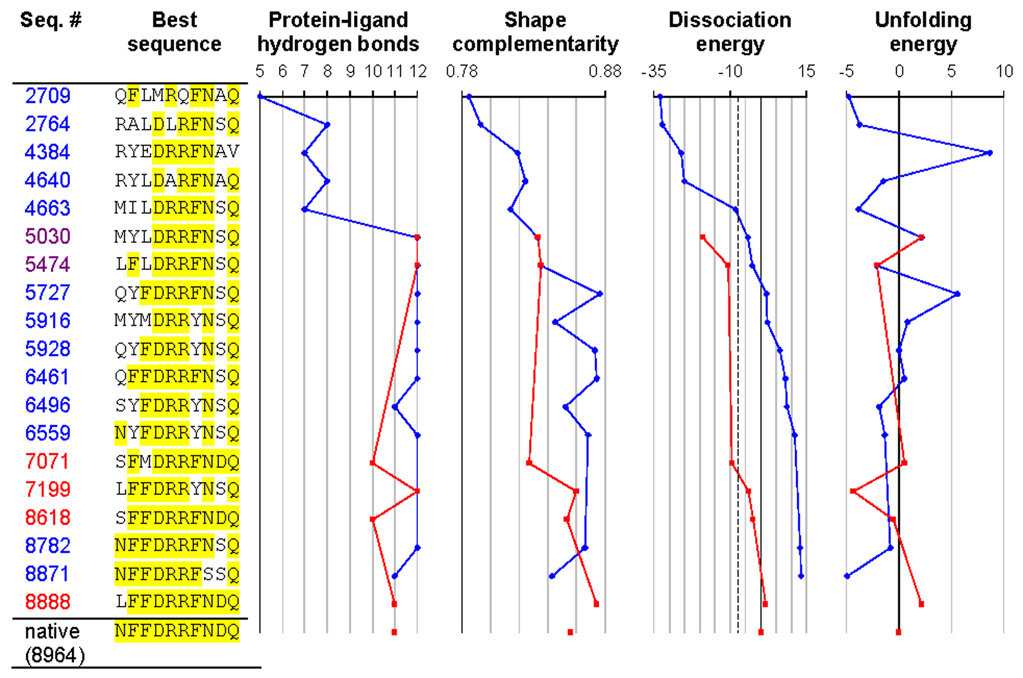
Figure 7.
Redesigning the ribose binding site in RBP. Positions identical to the native are highlighted in yellow. The figure shows the best sequence as a function of the number of sequences considered, using either the mean field dissociation energy as the criterion (blue trajectories) or alternatively the dissociation energy calculated using minimized structures (red trajectories). All sequences with a mean field dissociation energy greater than 30 kcal/mol (corresponding to −7.5 kcal/mol relative to the native sequence, dashed line) were locally energy minimized to generate the red trajectory. Sequence 8871 is the top sequence when ranked by mean field dissociation energy (corresponding to Table 1b), and sequence 8888 is the top sequence when ranked by minimized dissociation energy (corresponding to Table 1d). The native sequence was found out of a possible 2×10¹² sequences after 8964 sequence evaluations. Dissociation and unfolding energies are reported in kcal/mol, relative to the native sequence. The number of protein-ligand hydrogen bonds was determined using bndlst.53 Shape complementarity (which ranges from 0 for perfectly non-complementary surfaces to 1 for perfectly complementary surfaces) was calculated using sc.54 Backbone coordinates for the bound state are from 2DRI, and backbone coordinates for the unbound state are from 1URP.

