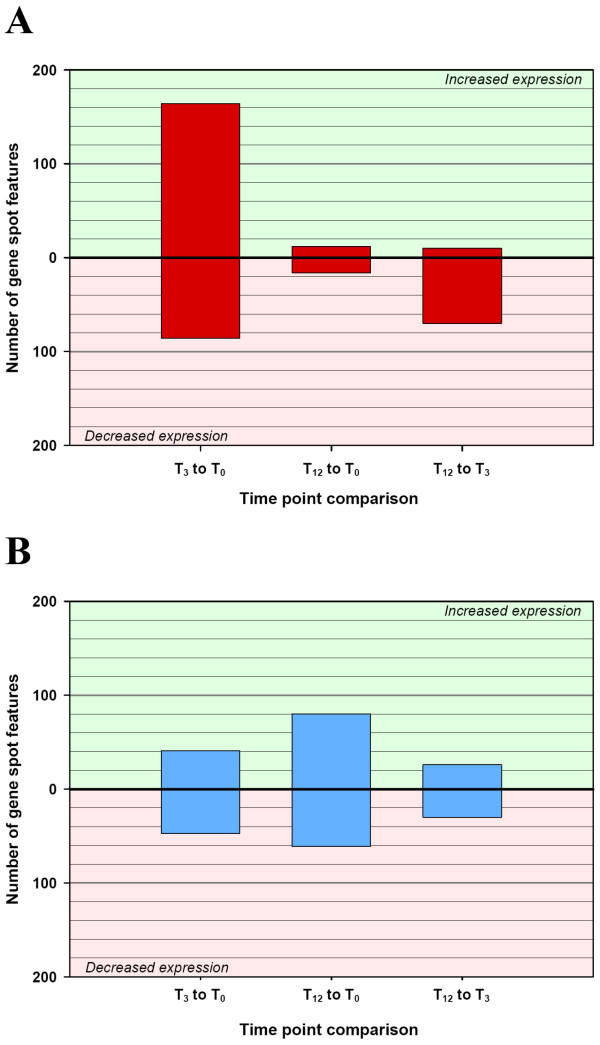
Figure 2.
Differentially expressed gene spot features between time points for the BTB-infected and control animal groups (P ≤ 0.05). Significant differentially expressed gene spot features (P ≤ 0.05) between time points (0 h, 3 h and 12 h) within the BTB-infected animal group (A) and the control non-infected animal group (B). The direction of the fold change, whether up or down, indicates a fold change difference between the first time point relative to the second time point.

