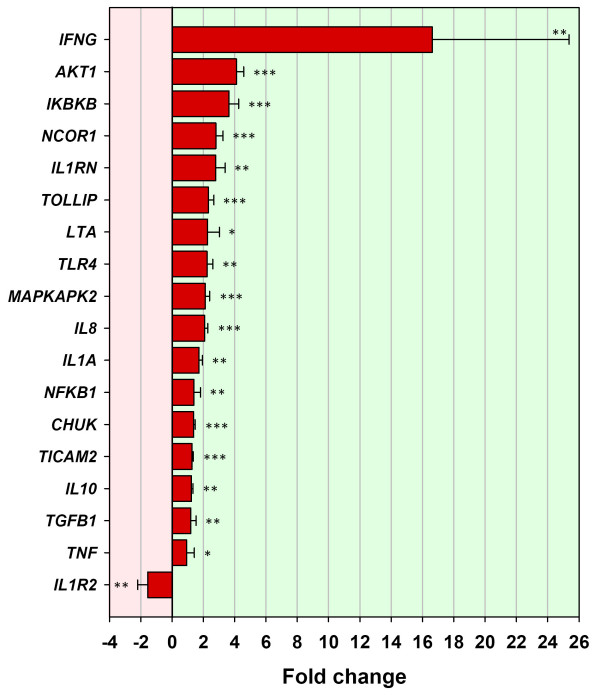
Figure 4.
Genes validated using real time qRT-PCR for the BTB-infected animal group (T3 relative to T0). Eighteen genes validated using real time qRT-PCR for the BTB-infected animal group between T3 (3 h post-bovine tuberculin stimulation) and T0 (0 h – no stimulation). Error bars show the standard error of the mean for each fold change estimate. Statistical significance for each gene is shown as follows: *P ≤ 0.05; **P ≤ 0.01; ***P ≤ 0.001.

