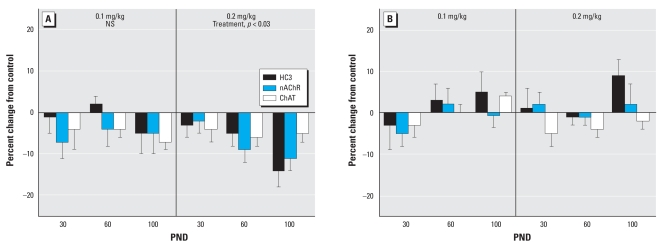
Figure 4.
Effects of neonatal parathion exposure on development of ACh synaptic markers in the midbrain of (A) males and (B) females. NS, not significant. Data represent means and SEs obtained from six males and six females in each treatment group at each age, presented as the percent change from control values. ANOVA across all treatments, ages and measures: for (A), treatment, p < 0.05; and for (B) NS. Lower-order ANOVAs for each dose are shown within the panels. Because treatment did not interact with other variables, only main treatment effects are listed.

