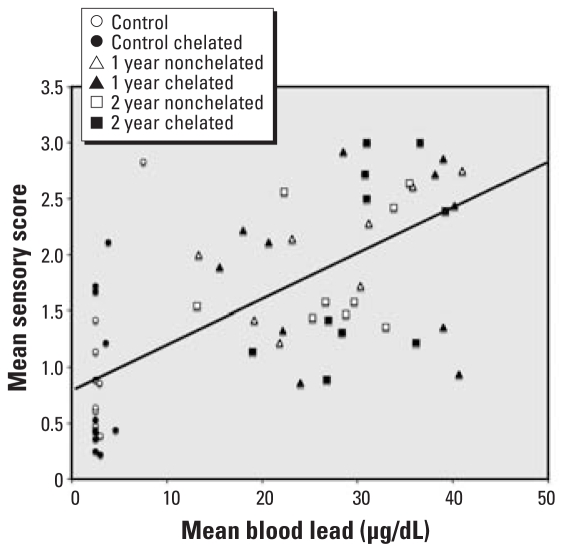
Figure 2.
Scatterplot of mean blood lead concentrations (μg/dL) at 2–12 weeks of age and mean sensory test score for lead-treated animals (n = 39). The solid line shows the regression of lead (x) and sensory score (y): y = 0.82 + 0.00375x; r = 0.42; p < 0.01. Control animals (n = 22) are presented for comparison but were not included in calculating the regression line. Including controls, r = 0.62, p < 0.01.

