Figure 1.

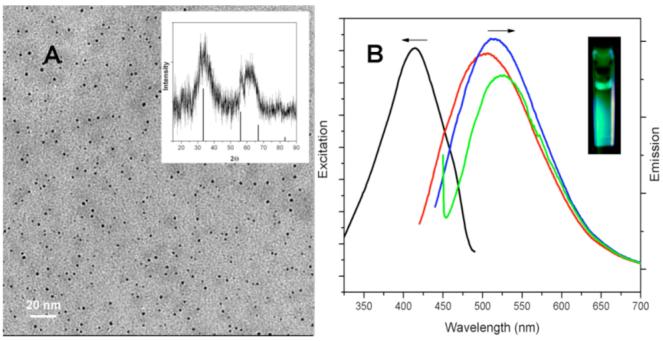
(A) TEM image of 5% Mn doped Si nanoparticles. Inset is XRD pattern of Mn doped silicon nanoparticles. The lines indicate the X-ray diffraction peak position for diamond structure silicon. (B) Excitation spectra (black) and Room temperature PL spectra of Si nanoparticles in chloroform at different excitation wavelengths: 400 nm (red); 420 nm (blue), and 440 nm (green). Inset: fluorescence from a cuvette of Mn doped Si nanoparticles when excited with a handheld UV lamp.
