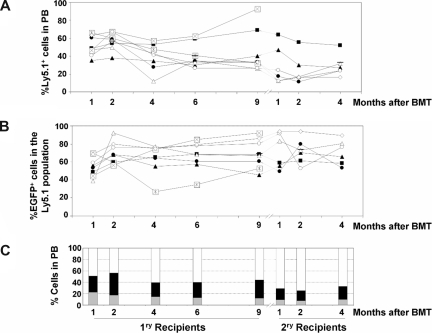
Figure 3.
Analysis of the competitive repopulating ability (CRA) of HSCs transduced with LVs as deduced from the analysis of primary and secondary recipients (experiment no. 2). (A) CRA of HSCs exposed to LVs relative to non–LV-exposed HSCs (percentage of Ly5.1-positive cells with respect to the whole population), as deduced from the analyses of PB from primary and secondary recipients. (B) CRA of HSCs transduced with LVs relative to HSCs exposed to, but not transduced with, the LVs (percentage of EGFP-positive cells inside Ly5.1+ population) in primary and secondary recipients. In panels A and B, each symbol corresponds to individual recipients. The same symbol is maintained for primary and secondary recipients as they were underwent transplantation on an individual basis (n = 9). (C) The mean contribution of each of the populations that reconstituted primary and secondary recipients with donor cells (LV-transduced cells: double-positive Ly5.1+ and EGFP+ cells [ ]; LV-exposed but not LV-transduced cells: Ly5.1+ EGFP− cells [
 ]; non–LV-exposed cells: Ly5.2+ cells [▭]). In this experiment, 2 secondary recipients died on days 9 and 12 after transplantation.

