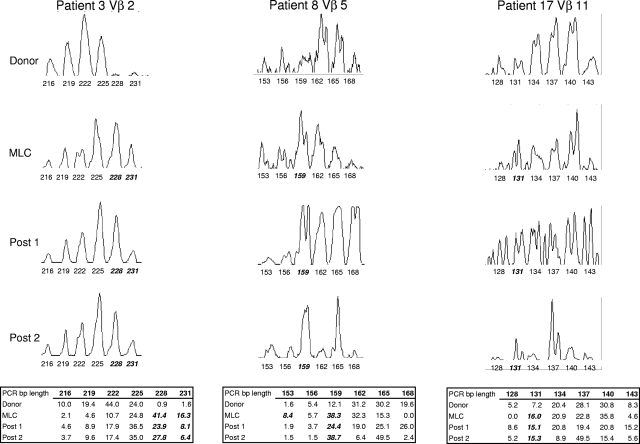
Figure 1.
Representative CDR3-size spectratype analysis of a Vβ family from 3 donor/patient pairs. Spectratype histograms were generated from donor PBLs, the MLC, and 2 posttransplantation samples for each Vβ shown. The area under each peak matching the PCR basepair (bp) product length is determined by the software program as described in “CDR3-size spectratype analysis” and is indicated in the table as a percentage of the total histogram. A peak within a spectratype is compared with its corresponding peak in the donor sample and is considered to be skewed (indicated in bold italics) if the percentage area is at least 2-fold that of the donor.

