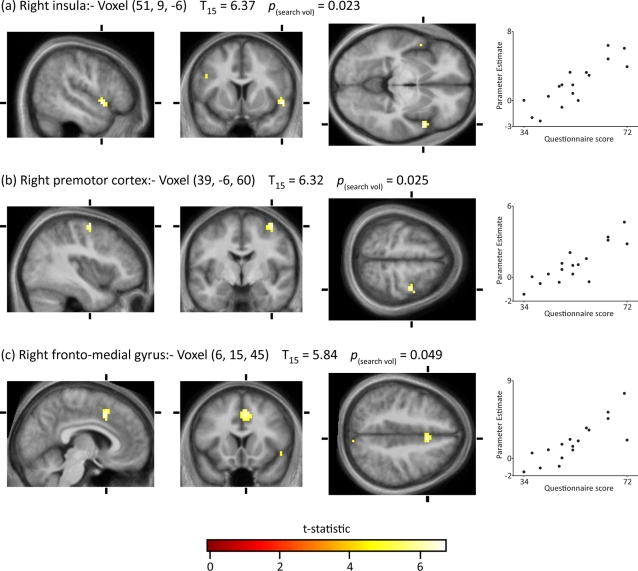
Figure 5. Voxels covarying with hate questionnaire score.
A search volume of 5,225 voxels was defined using the t-statistic for the effect Hated face>Neutral faces with the statistical threshold set at p≤0.01 (uncorrected). Within this search volume voxels were identified where the effect Hated face>Neutral faces covaried with the hate questionnaire score. The voxel-level statistical threshold was set at p≤0.05, family-wise corrected for multiple comparisons within the search volume . The graphs in the right hand column plot the parameter estimate of Hated face>Neutral faces against the questionnaire score at each voxel.

