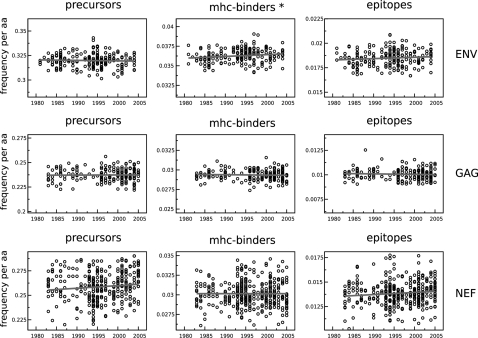
Figure 2. The predicted density of epitope precursors, MHC-binding peptides and CTL epitopes in ENV, GAG and NEF stay constant over time.
The density (expressed as frequency per amino acid) is plotted on the y-axis with the same scale factor within each column, which makes it possible to compare differences between proteins. The densities for MHC-binding and CTL epitopes are averaged over the 32 MHC-binding predictors. *: significant increase over time (Kendall Tau rank correlation test, p<0.01).

