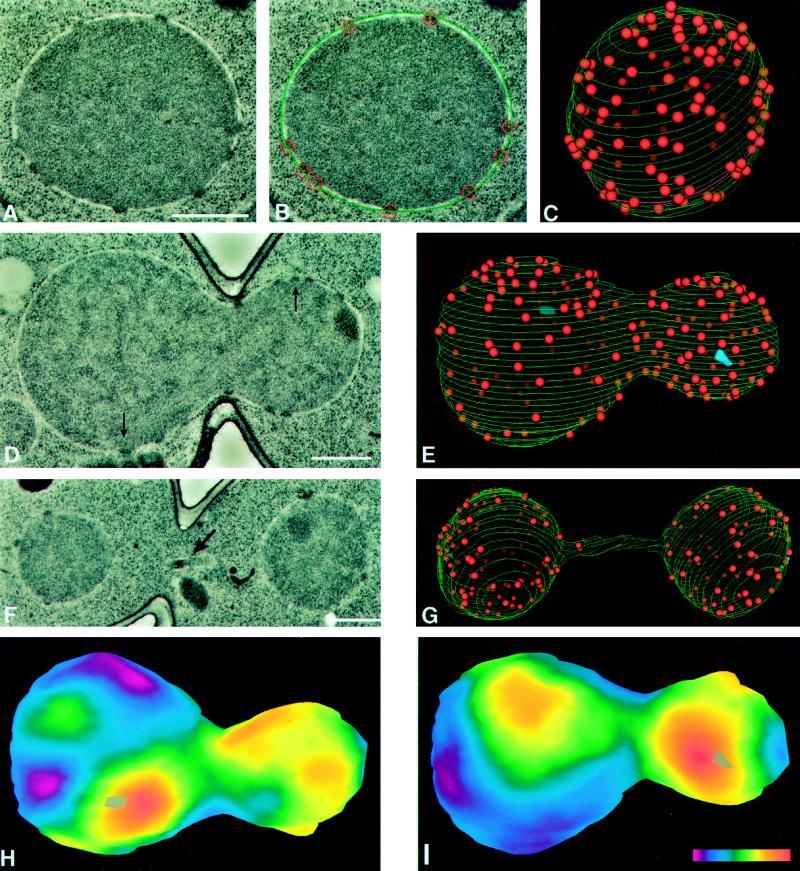
Figure 1.
Model building of nuclear envelopes is carried out by using digitized electron micrographs of serially sectioned nuclei (A) on which the outer nuclear envelope and the position of the NPCs are manually indicated (B, outer nuclear envelope is green and NPCs are red). After modeling on images of every section of a given nucleus, the 3D model can be displayed (C). Perspective and a gradient of lighting with depth have been used to differentiate NPCs on the front and back surfaces of the model. The magenta-colored contour near the bottom of the model (C) represents the section shown in A and B. Various statistics from this model can be extracted using the IMOD program (MATERIALS AND METHODS, see Table 1). The spherical nucleus shown in A–C is from an S-phase cell (Table 1, cell 15) and is similar to the nuclei seen in all the G1- and S-phase cells. Representative digitized electron micrographs of a mitotic (D; Table 1, cell 26; arrows indicate SPBs) and a late anaphase (F; Table 1, cell 32; arrow indicates a piece of the nucleus in the neck region) are shown, as well as the models of the nuclei in these cells (E and G, respectively; blue objects in E are SPBs). Two projections (H and I) of a smoothed surface density map of the mitotic nucleus in D and E, generated as described in MATERIALS AND METHODS. The projections show the front (I) and back (H) surfaces of the model with respect to the orientation shown in E. Positions of the SPBs are indicated by gray objects (one each in H and I). The color bar (I inset) shows the colors corresponding to densities from zero (magenta) to 26.7 NPCs/μm2 (red). Scale bars, 0.5 μm.

