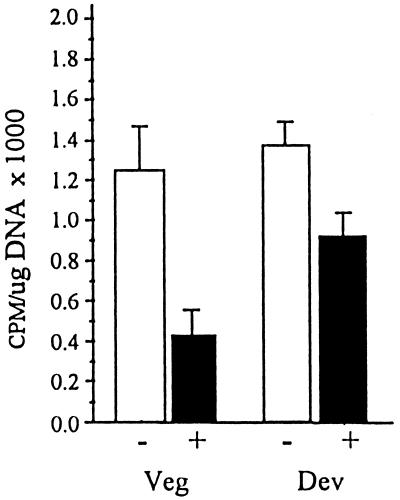
Figure 3.
Inhibition of DNA replication by aphidicolin. The shaded columns show the extent of 3H incorporation by aphidicolin-treated cells; the unshaded columns show 3H incorporation by untreated cells. The columns marked VEG show the 3H incorporation by vegetative cells; those marked DEV show the 3H incorporation by cells at 35 h of development. The bars above each column represent the SD.

