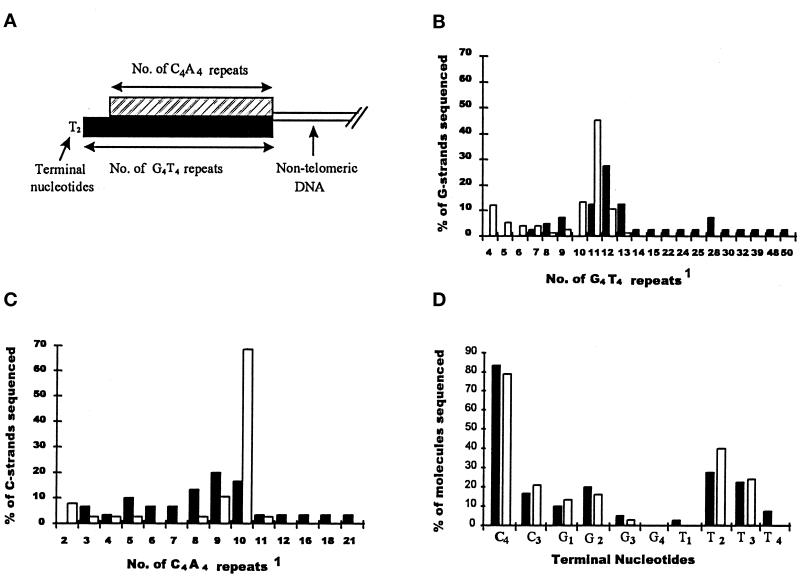
Figure 6.
G- and C strand length distribution. (A) Features of a Euplotes telomere. (B) Comparison of the length of the telomeric G-strands from control cells (the clear bars) and aphidicolin- treated cells (black bars). For molecules with telomeres longer than 200 nucleotides (25 repeats), the number of G4T4 repeats represents the minimum number of repeats present. (C) Comparison of the length of the telomeric C-strands from control cells (clear bars) and aphidicolin-treated cells (black bars). The data for the control cells in panels B and C are a combination of the data mentioned in the results and in Vermeesch and Price (1994). 1, Note the scale on the x axis is not linear. (D) Identity of the terminal nucleotides on the G- and C-strands of telomeres from untreated cells (clear bars) or aphidicolin-treated cells (black bars).

