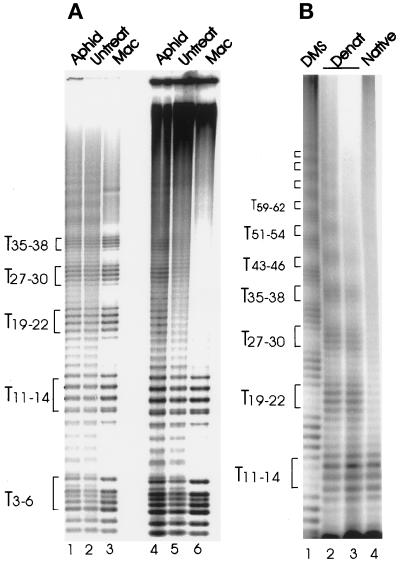
Figure 7.
Examination of 3′ overhang length by KMnO4 footprinting. The samples in panel A were run on a 15% sequencing gel while the samples in panel B were run on an 8% gel. (A) Lanes 1–3, denatured DNA from anlagen of aphidicolin-treated cells (lane 1), anlagen of untreated cells (lane 2), or mature macronuclei (lane 3). Lanes 4–6, nondenatured DNA from aphidicolin-treated cells (lane 4), untreated cells (lane 5), or mature macronuclei (lane 6). The heterogeneity in the lower bands of the T4 repeat pattern was caused by end labeling of molecules ending in both G2 and G1 (the macronuclear DNA was slightly degraded). (B) Lane 1, marker lane showing the G-cleavage pattern obtained after DMS treatment of anlagen DNA from untreated cells. Lanes 2 and 3, T-cleavage pattern obtained after KMnO4 footprinting of denatured anlagen DNA from untreated cells; lane 2, 1 mM KMnO4; lane 3, 2 mM KMnO4. Lane 4, T-cleavage pattern obtained with nondenatured anlagen DNA from untreated cells after footprinting with 1 mM KMnO4.

