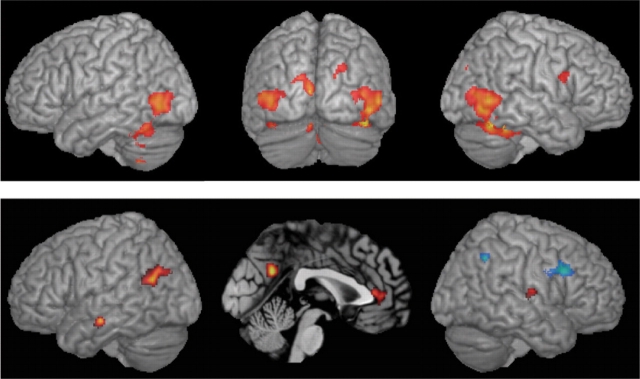
Fig. 4.
Standard brain render showing results of the random effect analysis (t-test) of the effect of stimulus presentation across models and types of motions (FDR-corrected P < 0.05, k > 50 voxels) at the top and of the activity positively (hot scale) and negatively (cold scale) correlated with the response bias (FDR-corrected P < 0.05, k > 50) at the bottom.

