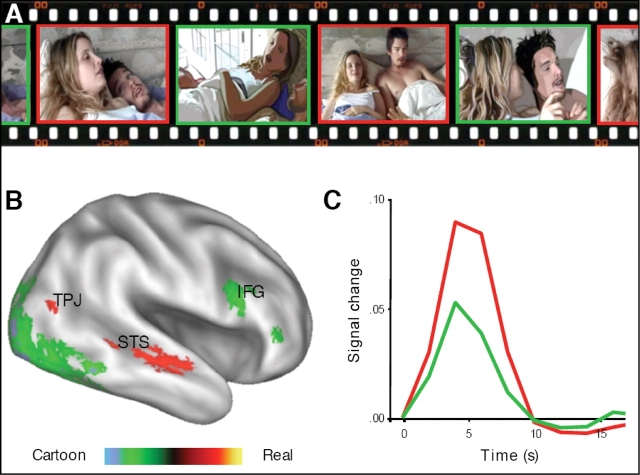
Fig. 2.
(A) Sample of video with real (red) and computer-generated (green) actors. (B) An inflated cortical representation of the right-hemisphere shows greater activation for live-action than for animated sequences in the TPJ and STS. Greater activation for animated than for live-action sequences was observed in the lateral occipital cortex (LOCC; see Table 2), and the inferior frontal gyrus (IFG). (C) Hemodynamic response function observed in the STS for live-action (red) and animated (green) sequences. The TPJ showed a similar pattern of activation.

