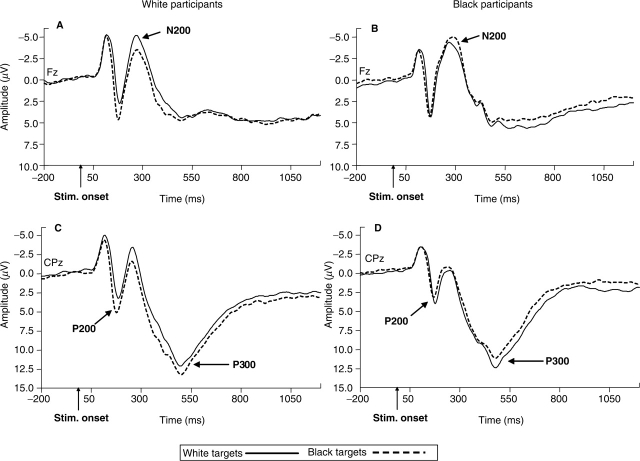
Fig. 2.
ERPs elicited by Black and White targets as a function of participant race. Panels A and B show waveforms measured from the frontal midline electrode (Fz), where the N200 was largest, collapsed across all factors except target race. Panels C and D show waveforms measured from the central-parietal midline electrode (CPz), where the P200 was maximal, collapsed across all factors except target race. Panels A and C present data recorded from White participants, and Panels B and D present data recorded from Black participants.

