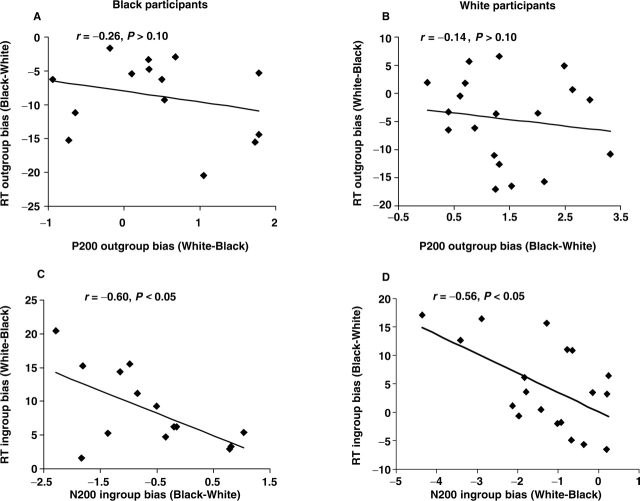
Fig. 3.
Correlations between ERP and RT indices of outgroup bias (panels A and B) and ingroup bias (panels C and D), separately for White and Black participants. Panels A and C show correlations for Black participants, and Panels B and D show the correlations for White participants. For both Black and White participants, a larger N200 to ingroup relative to outgroup targets was associated with a faster response to ingroup relative to outgroup targets.

