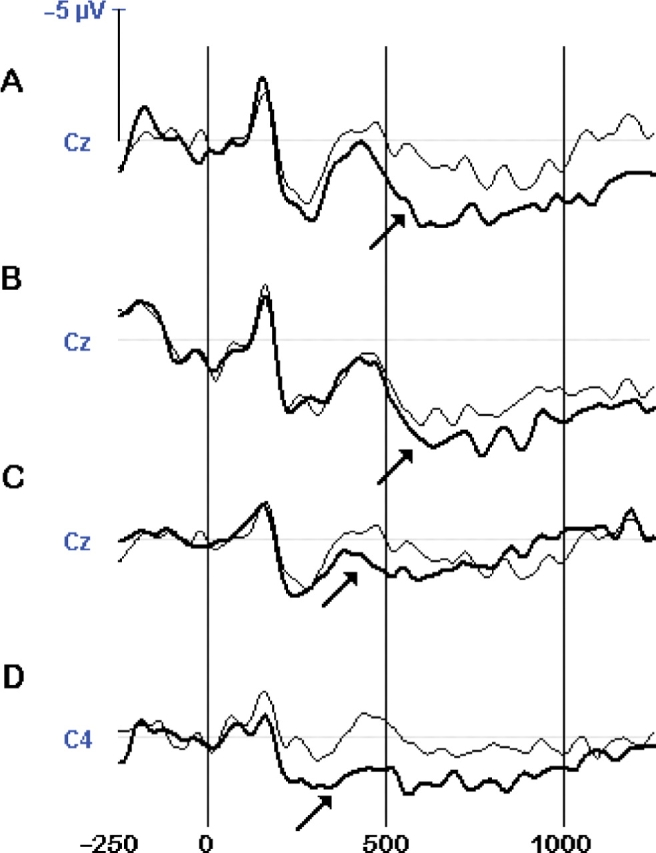
Fig. 1.

Effects of inconsistency on grand-averaged ERP waveforms showing a P300 in a positive trait context at the Cz and C4 scalp sites for evaluative trait inconsistencies (TC vs TI) given (A) STI and (B) ITI; and for descriptive trait inconsistencies (TC vs CI) given (C) STI and (D) ITI. Dark lines denote inconsistencies and light lines denote consistencies. The timeline is given in ms. A positive amplitude is shown downward. The arrow indicates the onset of the P300.
