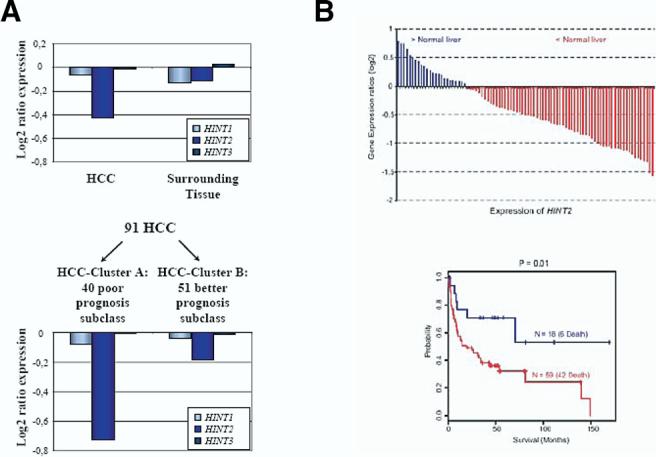
Figure 9.

(A) Expression of HINT1, HINT2, and HINT3 in 91 hepatocellular carcinomas and their surrounding tissues analyzed by microchip array (upper panel) and in the 91 hepatocellular carcinoma samples divided according to prognosis (lower panel). HINT2 mRNA was less abundant in hepatocellular carcinoma than in adjacent tissue (−0.424 ± 0.579 vs −0.109 ± 0.277 log2; P < .0002) and less abundant in tumors with a poor prognosis than in those with a better prognosis (−0.728 ± 0.522 vs −0.187 ± 0.506 log2; P < 1.0 × 10⁻⁵). Such changes were not observed for HINT1 or HINT3. (B) Survival difference of patients with hepatocellular carcinoma based on the expression patterns of HINT2. Patients were ranked on the basis of HINT2 mRNA levels in tumoral tissue using normal liver as reference and separated into 2 groups as indicated (upper panel). Kaplan–Meier plot of overall survival of patients with hepatocellular carcinoma grouped on the basis of HINT2 mRNA expression level (lower panel). The difference between groups was significant (P = .01, log-rank test).
