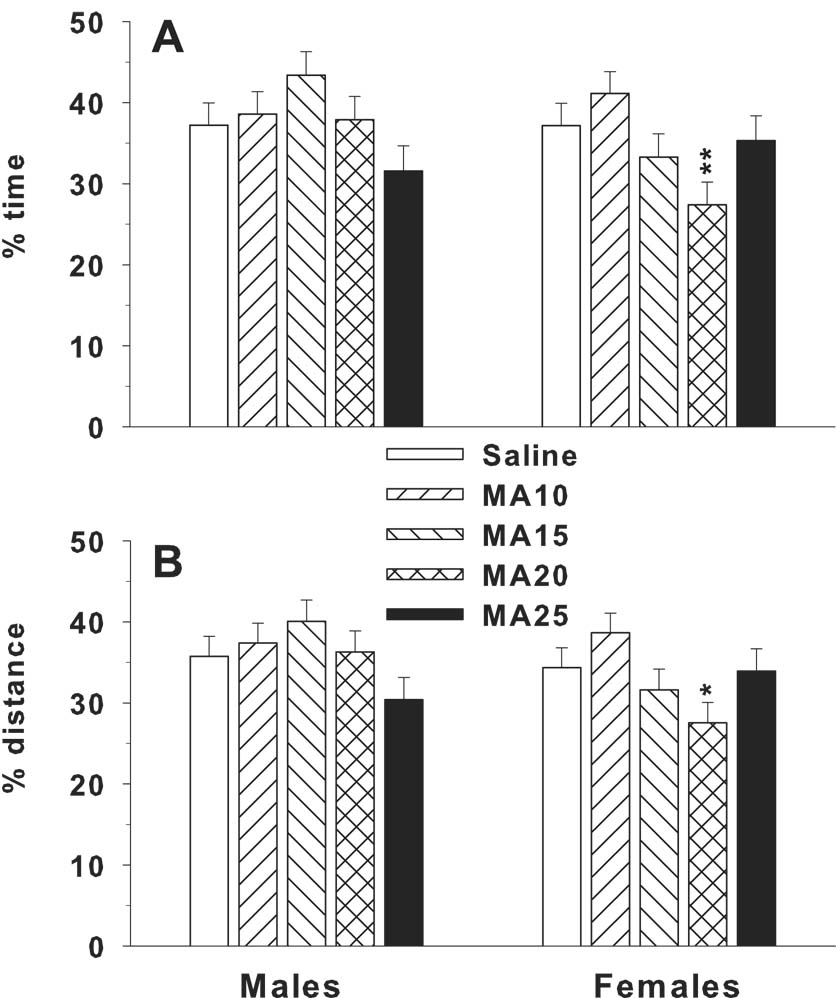
Fig. 7.
Morris water maze probe trial performance 24 h after the last trial of acquisition. Shown are mean (± SEM) percent time (top panel) and distance (bottom panel) spent in the target quadrant with the platform removed during the 30 s probe trial. *P < 0.05, **P < 0.01 vs. SAL. Group sizes are as in Fig. 6.

