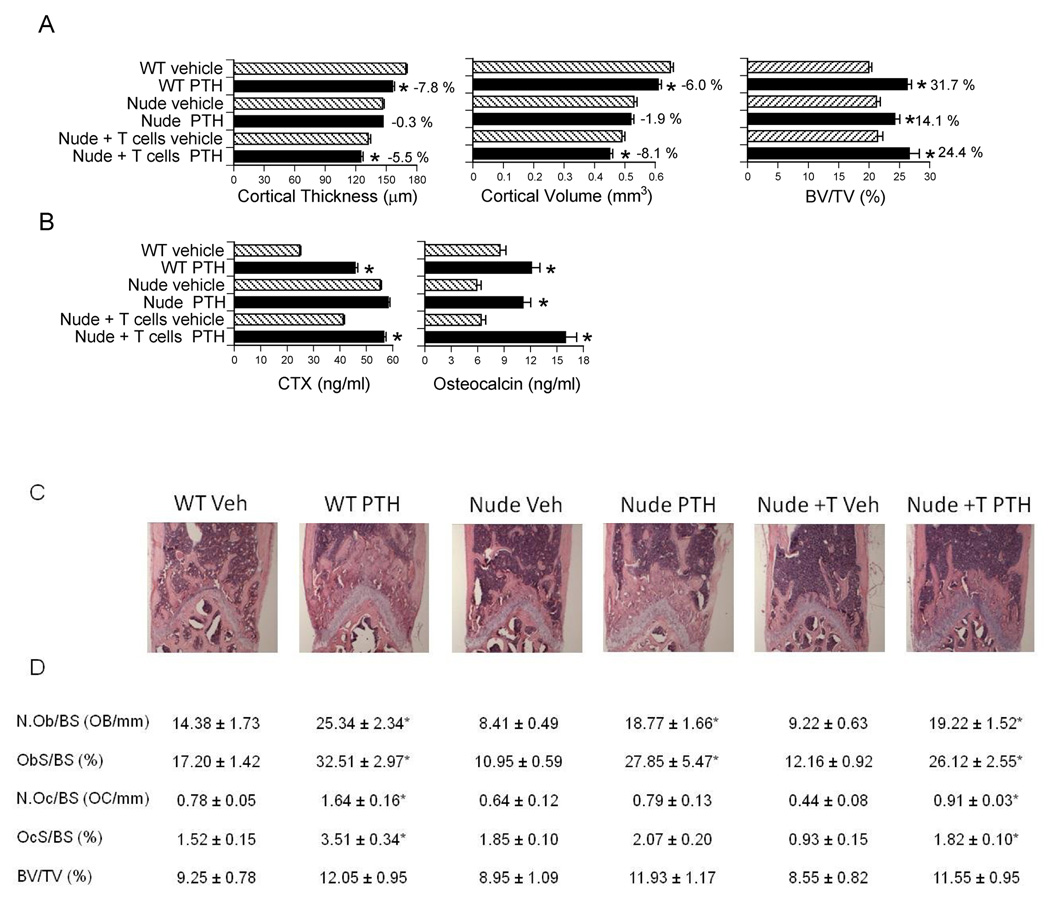
Figure 1.
Analysis of the effects (mean ± SEM) of cPTH in WT mice, nude mice, and nude mice previously subjected to adoptive transfer of WT T cells. * = p<0.05 as compared to the corresponding vehicle treated group. A Ex vivo µCT analysis of femur cortical and trabecular bone (n = 12 mice per group). B serum CTX and osteocalcin levels (n = 12 mice per group). C H and E staining of representative longitudinal sections of distal femurs. D Histomorphometric analysis of femoral trabecular bone volume, formation, and resorption. N.Ob/BS (the number of osteoblasts per mm bone surface), and ObS/BS (the percentage of bone surface covered by osteoblasts) are indices of bone formation. N.Oc/BS (the number of osteoclasts per mm bone surface), and OCs/BS (the percentage of bone surface covered by OCs) are indices of bone resorption. BV/TV (the percentage of trabecular volume occupied by bone volume) is an index of bone structure. n= 8–10 mice per group.

