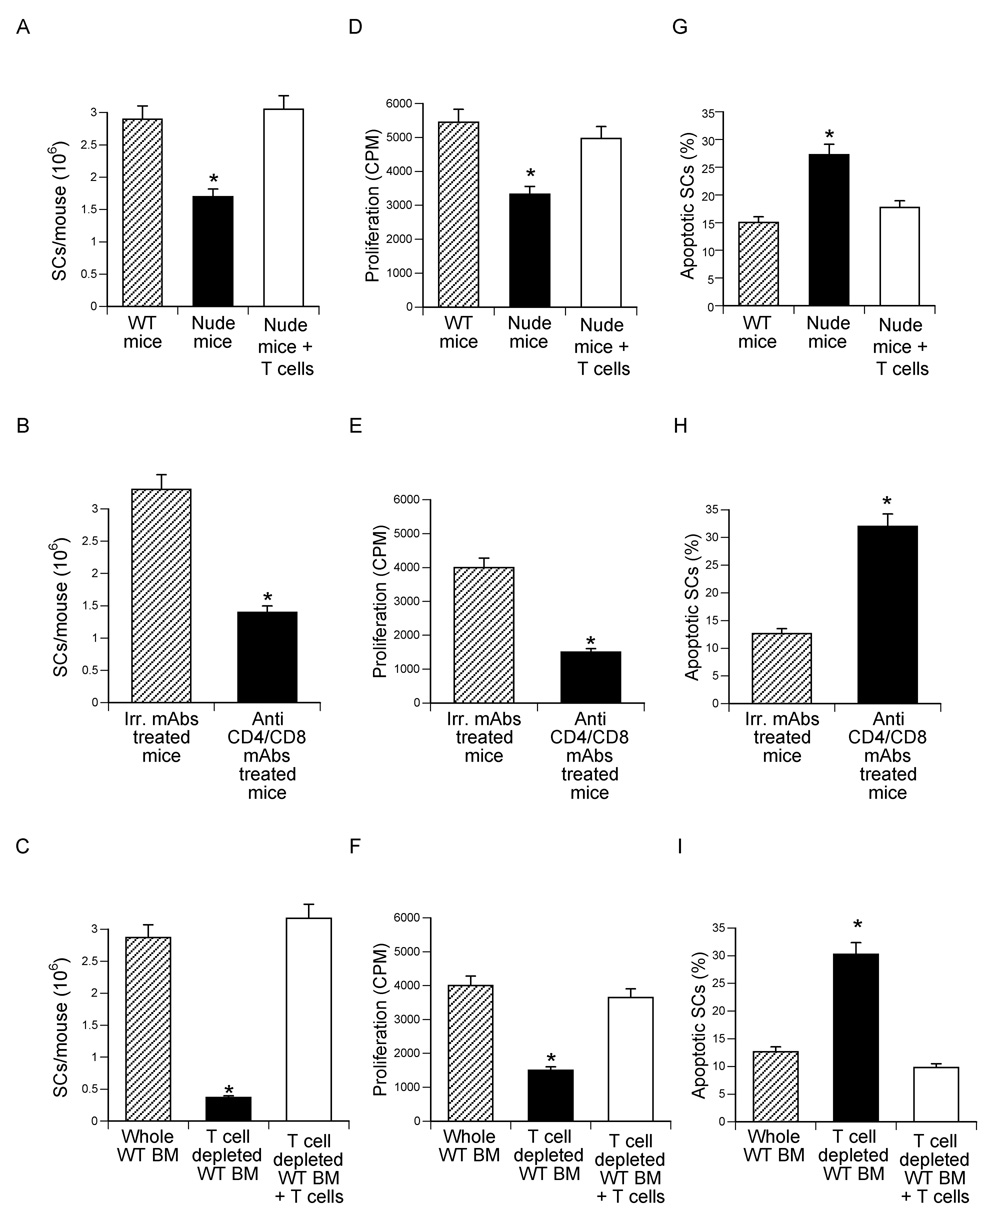
Figure 4.
Effects (mean ± SEM) of T cells on SC number, proliferation and apoptosis. SCs were purified from BM harvested from T cell deficient nude mice, WT mice depleted of T cells in vivo via injection of anti CD4/8 mAbs, and WT mice depleted of T cells in vitro by immunomagnetic selection. Control groups included nude mice subjected to adoptive transfer of spleen WT T cells 2 weeks earlier, BM from WT mice treated with irrelevant mAbs, and WT mice first depleted of T cells in vitro and immediately reconstituted with WT BM T cells. n = 3 wells per group. A–C number of SCs/mouse yielded by the purification procedure. *= p<0.05 as compared to the other groups. D–F SC proliferation assay. SCs were purified as described in the methods, seeded in equal number, cultured for 3 days, and pulsed with thymidine for the last 18 hours of culture. Data are expressed in CPM. *= p<0.05 as compared to the other groups. G–I % Analysis of the rate of SC apoptosis. SCs were cultured for three days and their rate of apoptosis determined by TUNEL staining at the end of the culture period. *= p<0.05 as compared to the other groups.

