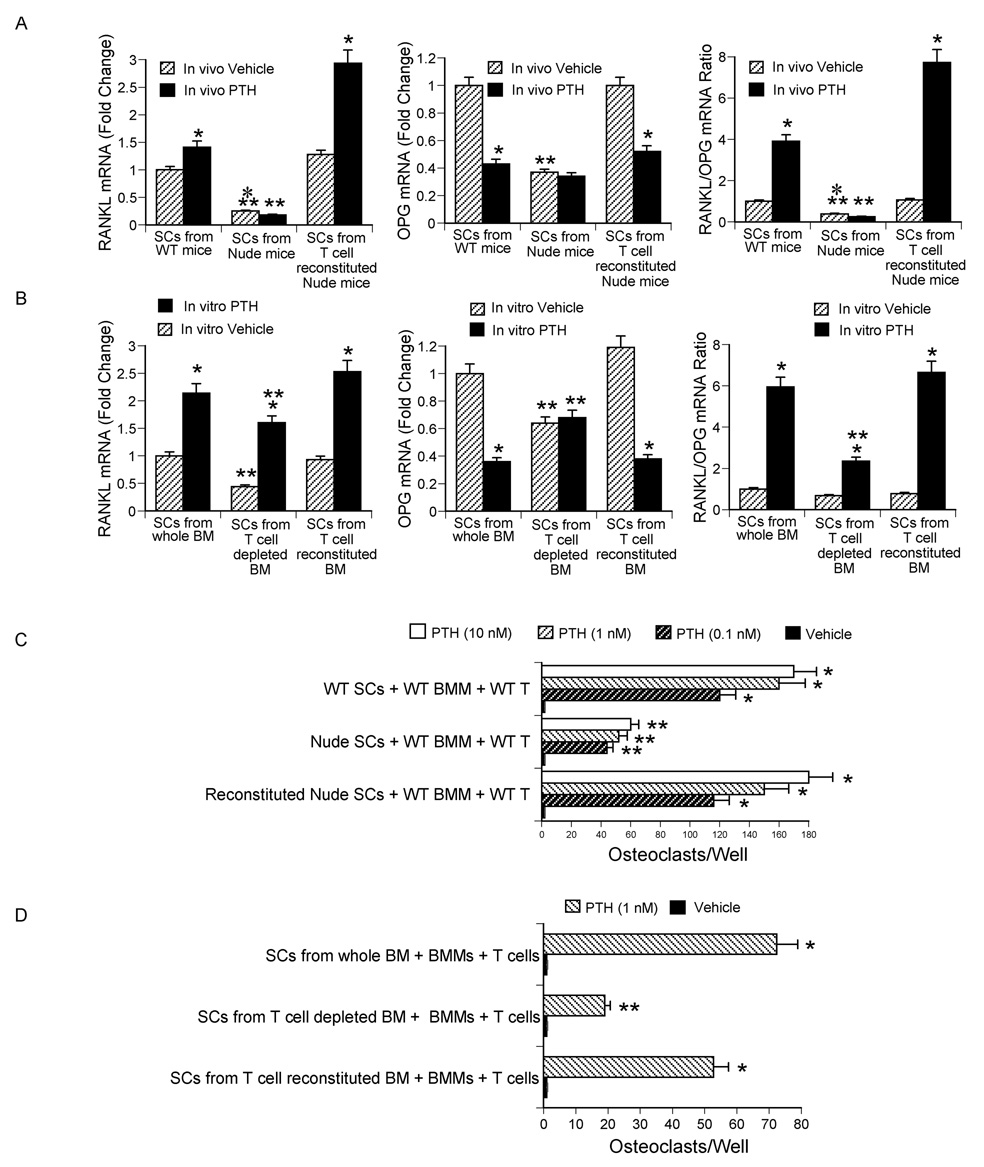
Figure 5.
Effect (mean ± SEM) of T cells on RANKL/OPG mRNA expression by BM SCs and SC osteoclastogenic activity. A mRNA levels of RANKL and OPG and RANKL/OPG mRNA ratio in SCs from nude mice. *= p<0.05 as compared to the corresponding vehicle group. **= p<0.05 as compared to the corresponding WT and T cell reconstituted groups. B mRNA levels of RANKL and OPG and RANKL/OPG mRNA ratio in SCs from WT mice depleted of T cells in vitro. *= p<0.05 as compared to the corresponding vehicle group. **= p<0.05 as compared to the corresponding WT and T cell reconstituted groups. C BMMs and T cells from WT mice were cocultured with SCs from nude and control mice for 1 week in the presence of PTH. Cocultures were stained for TRAP and OCs counted. *= p<0.05 compared to vehicle. **= p<0.05 compared to vehicle and to the corresponding PTH treated groups with SCs from WT and T cell reconstituted nude mice. D BMMs and T cells from WT mice were cocultured for 1 week in the presence of PTH with SCs from either WT BM depleted of T cells in vitro or control BM. *= p<0.05 compared to vehicle. **= p<0.05 compared to vehicle and to PTH treated groups with SCs from whole and reconstituted BM.

