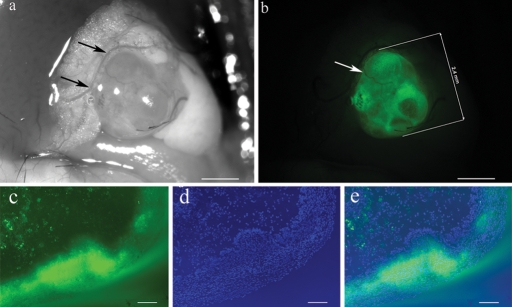
Figure 2:
Macroscopic and histological appearance of an enhanced green fluorescent protein expressing lesion embedded in fat tissue 10 days after injection of endometrium fragments.
(a) Lesion under impinging light shows the embedding in blood supplied fat tissue. Supporting blood vessels are indicated by arrows. (b) Same lesion examined under fluorescent light. A supporting blood vessel is indicated by the arrow. (c–e) Picture of a frozen lesion section taken with 800 ms exposure time showing (c) EGFP-expressing cells under fluorescent light, (d) all nuclei (DAPI-staining) and (e) the merged image. Scale bar a–b = 1 mm, c–e = 100 µm. Original magnification c–e: ×100.

