Figure 4:
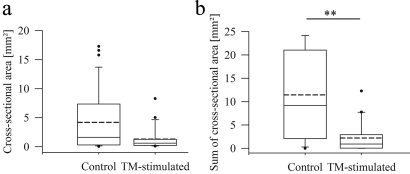
CSA and sum of the CSAs of endometriotic lesions in controls compared with TM-stimulated mice shown in box plots.
(a) Ten days after injection of EGFP-expressing endometrium fragments in the inflamed peritoneal cavity, the CSA of lesions was determined in controls and TM-treated animals with lesions. Comparison displayed a tendency towards smaller CSA (P = 0.0943). (b) The sum of CSAs per mouse was compared between all controls and all TM-treated mice showing a significantly lower disease burden in treated animals (**P = 0.0013). The solid line indicates the median, the dashed line the mean. Statistical analysis was performed using a two-tailed F-test for CSA comparison and a two-tailed Wilcoxon rank-sum test for analysis of sum CSA.

