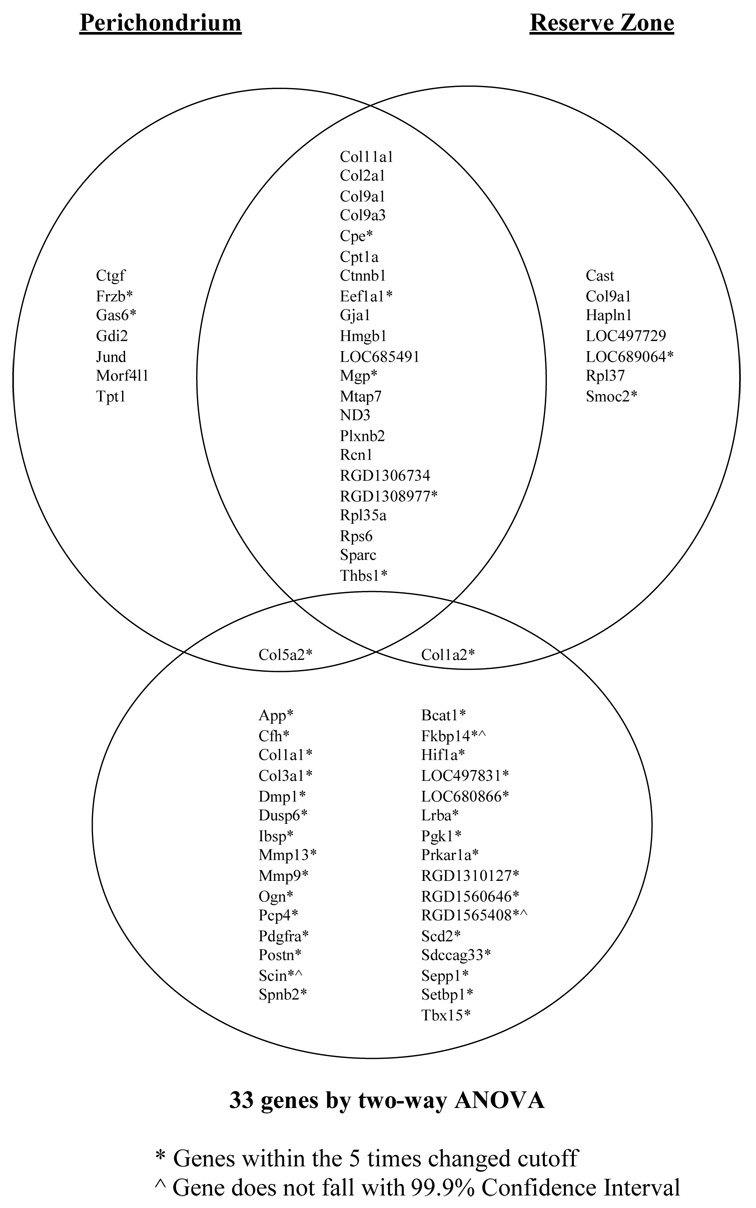
Figure 2. Top 30 genes in PC and RZ by greatest expression compared to 33 genes by two-way ANOVA and 5 times changed.
To identify the significant differential gene expression between PC and RZ chondrocytes, the PZ was used as a comparator. Normalized data was filtered on expression using a cutoff of five times changed up or down in PC, RZ and PZ described as in the methods section. Differential expression between zones was analyzed using two-way ANOVA and created a gene list of 33 significant differentially expressed genes. When comparing the gene list of 33 significantly different than the PZ to the top 30 by expression in both PC and RZ, there was one gene in common for each of the zones.

