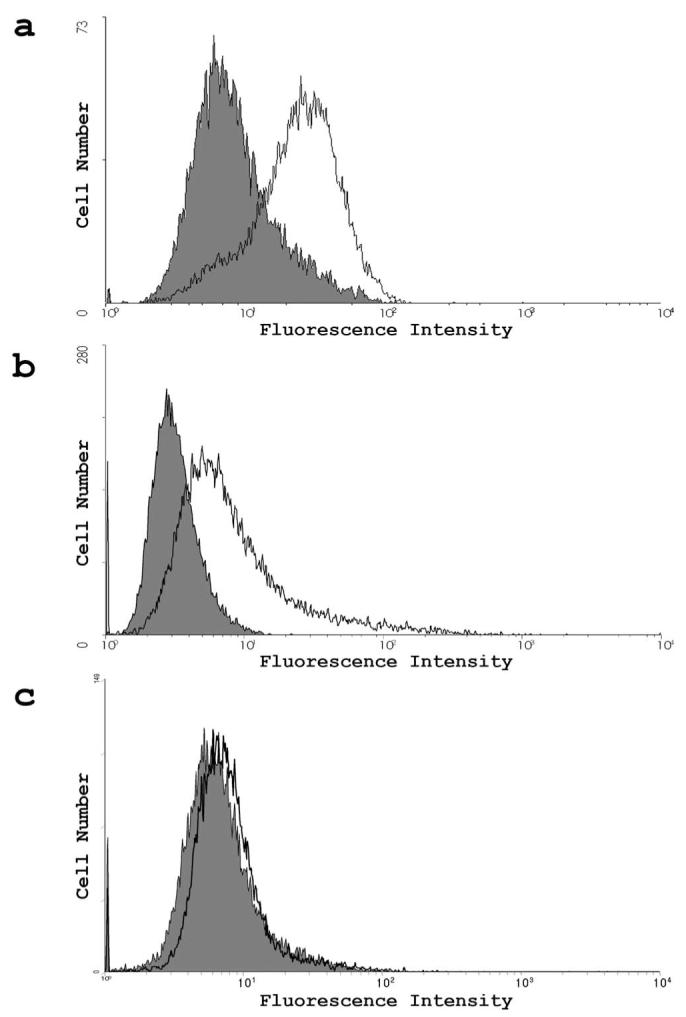
FIGURE 7.

Flow cytometry measurement of receptor expression. (a-c) Expression was detected by FACS analysis. Cells were treated with primary antibodies for nectin-1 (a), HVEM (b), and 3-OS HS(c). Controls were treated with secondary antibodies only and are shown in gray on the graph.
