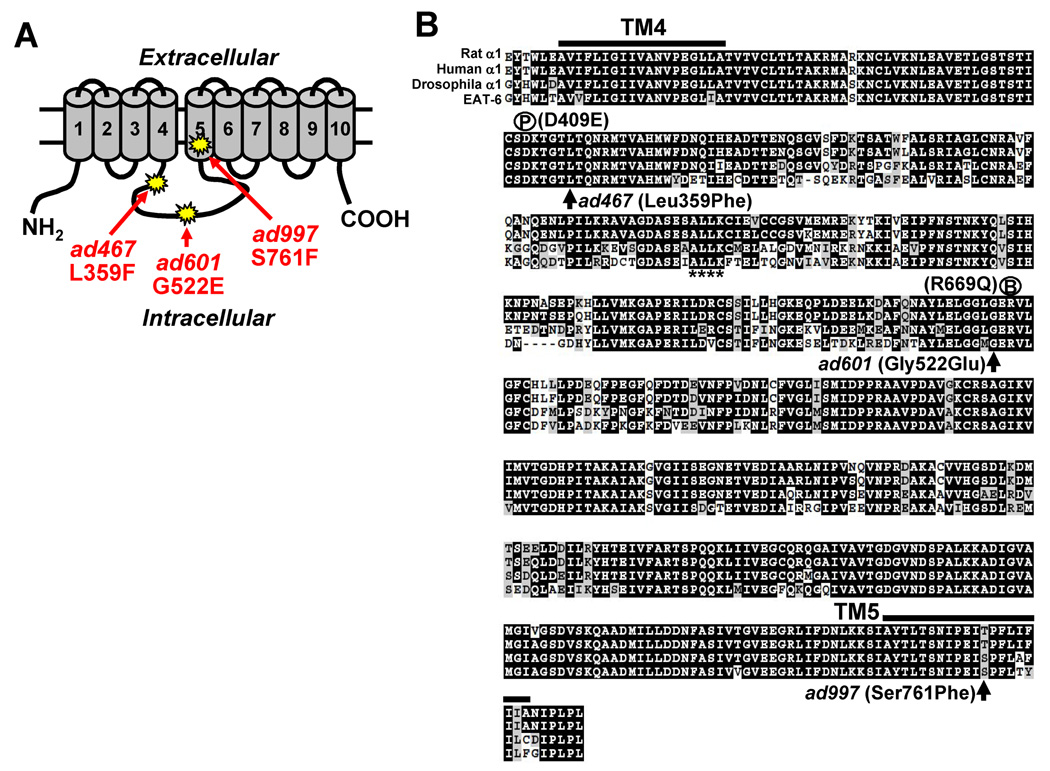
Figure 7. Amino acid alignment of Na+/K+ ATPase α1 subunits.
(A) Schematic representation of the Na+/K+ ATPase α subunit. Columns indicate the transmembrane regions. The sites of three eat-6 mutant alleles are shown. (B) The amino acid sequences of rat α1, human α1, Drosophila α1 and EAT-6 were aligned using ClustalW. The region from the 4th transmembrane domain to the 5th transmembrane domain is shown. Each mutation site is indicated by arrows. P, phosphorylation site; B, ATP-binding site. The ankyrin-binding motif is shown by asterisks under the amino acids.

