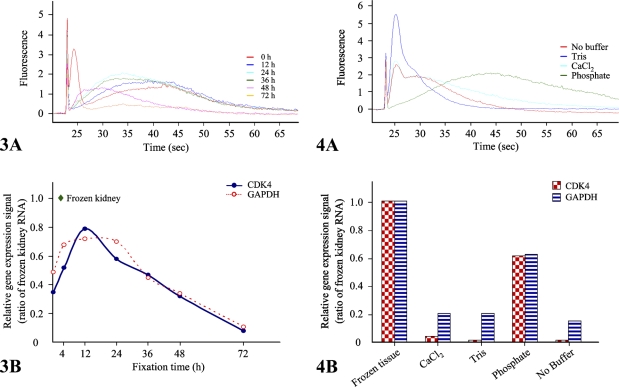
Figure 3.
Assessments of RNA profiles according to fixation times. We analyzed RNA quality using the Agilent 2100 bioanalyzer, using 200 ng of total RNA extracted from mouse kidney formalin-fixed, paraffin-embedded (FFPE) tissues after 0, 12, 24, 36, 48, or 72 hr of fixation. Representative data are presented as an electropherogram (A). To measure quantitatively RNA degradation, we performed QuantiGene assays with CDK4 and GAPDH gene-specific probe sets using the QuantiGene reagent system (Panomics). Relative expression signals of both genes are normalized to that of frozen kidney (B). Data are the mean of three independent experiments.

