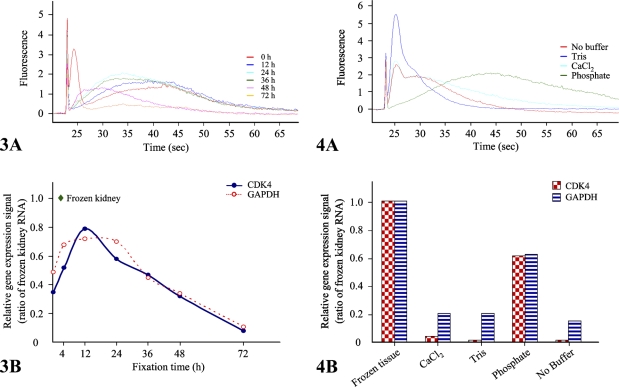
Figure 4.
RNA quality and gene expression profiles from different fixative buffers. Total RNA was extracted from mouse kidney. Tris-, phosphate-, and CaCl2-buffered formalin and unbuffered formalin-fixed tissues were coupled with paraffin-embedded processing. The total RNA samples (200 ng) were analyzed on an RNA LabChip using the Agilent 2100 bioanalyzer and are shown here as an electropherogram (A). CDK4 and GAPDH gene expressional profiles were measured with 500 and 200 ng of total RNA extracted from those samples, respectively. Relative expressional signal of both genes are normalized to that of frozen kidney (B). Data are the mean of three independent experiments.

