
Figure 3.
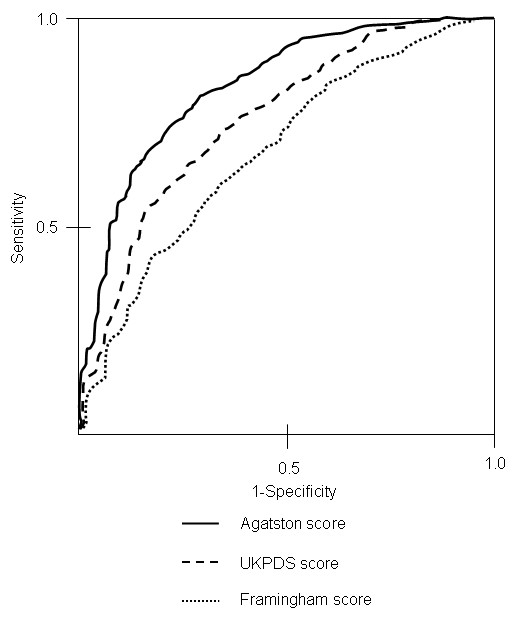
ROC curves and area under the curve of UKPDS score, Framingham score, and Agatston score for the prediction of myocardial infarction.
Official websites use .gov
A
.gov website belongs to an official
government organization in the United States.
Secure .gov websites use HTTPS
A lock (
) or https:// means you've safely
connected to the .gov website. Share sensitive
information only on official, secure websites.
ROC curves and area under the curve of UKPDS score, Framingham score, and Agatston score for the prediction of myocardial infarction.