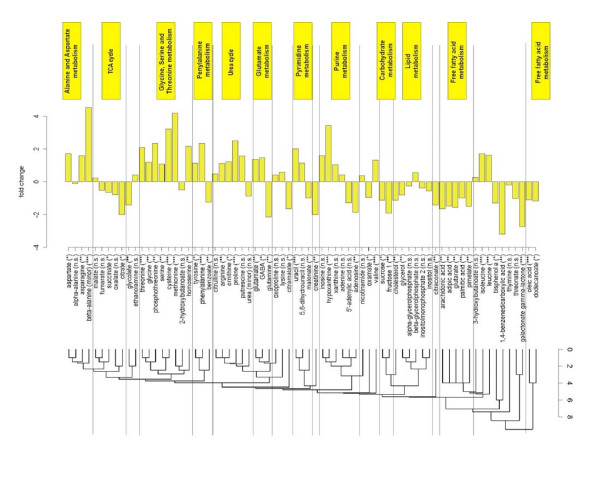
Figure 7.
PROFILE analysis – comparison of metabolic differences between colon cancer and normal tissue clustered according to the relational pathway information from the KEGG REACTION database. Significance of the metabolic differences is designated by the stars behind the metabolite names: *** (high significance, p < 0.00024), ** (medium significance, p < 0.01), * (low significance, p < 0.05). The scale at the dendrogram refers to the number of main reactions in the KEGG database that link the metabolites to each other.

