Figure 6.

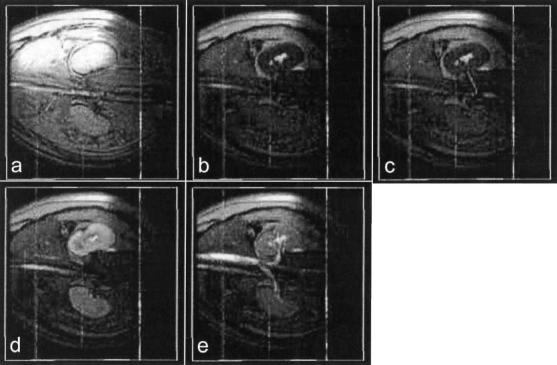
Volume renderings of the renal angiography example using MIP. Time frames a–e are the same as in Fig. 5. Renal artery, kidney, renal vein, aorta, and vena cava are all visible in the renderings.

Volume renderings of the renal angiography example using MIP. Time frames a–e are the same as in Fig. 5. Renal artery, kidney, renal vein, aorta, and vena cava are all visible in the renderings.