
Figure 3. 5’ AMP reduces the attenuation of GABA-activated K+ currents in GIRK cells via phosphorylation of S783 in R2.
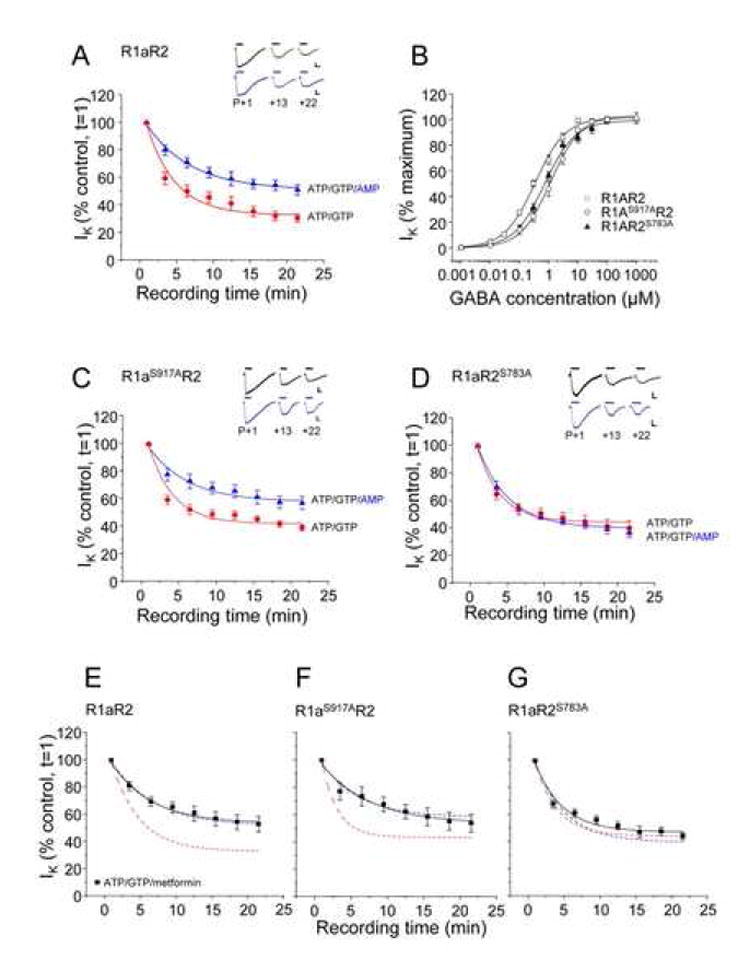
A. GIRK cells transfected with wild-type R1aR2 GABAB subunits were exposed to 10μM GABA, at the time points indicated, with the internal patch pipette solutions containing either 2mM ATP and 1mM GTP (●) or 1mM AMP, 2mM ATP and 1mM GTP (▲) from n = 5-13 cells. All Insets show sample membrane currents (calibration bars 200pA, 2s). B. Concentration response relationships for R1aR2 (□), R1aS917AR2(○) and R1aR2S783A (▲) GABAB receptors (n = 5-12 cells) with an internal solution containing 14mM CP, 2mM ATP and 1mM GTP normalized to the maximum GABA peak current (1mM) and fitted with the Hill equation (see methods). C and D. GIRK cells transfected with R1aS917AR2 (C) or R1aR2S783A (D) GABAB subunits were exposed to 10μM GABA, at the time points indicated, with the internal patch pipette solutions containing either 2mM ATP and 1mM GTP (●) or 1mM AMP, 2mM ATP and 1mM GTP (▲) from n=5-16 cells. E,F and G. Metformin reduces the attenuation of GABA-activated K+ currents of GABAB receptors. GIRK cells transfected with wild-type R1aR2 (E), R1aS917AR2 (F) and R1aR2S783A (G) GABAB subunits were exposed to 10μM GABA, at the time points indicated, with the internal patch pipette solution containing, 2mM ATP, 1mM GTP and 1mM metformin (■). Fitted lines taken from panels A, C and D are shown for comparison. Data from n=4-12 cells. All responses have been normalized to the response recorded just after the formation of the whole-cell recording mode (t=1). Data are mean ± s.e.m. Curves are monoexponential fits to the data points.