
Figure 1. Age patterns in the fair/poor health gradient, NHIS 1986–1995.
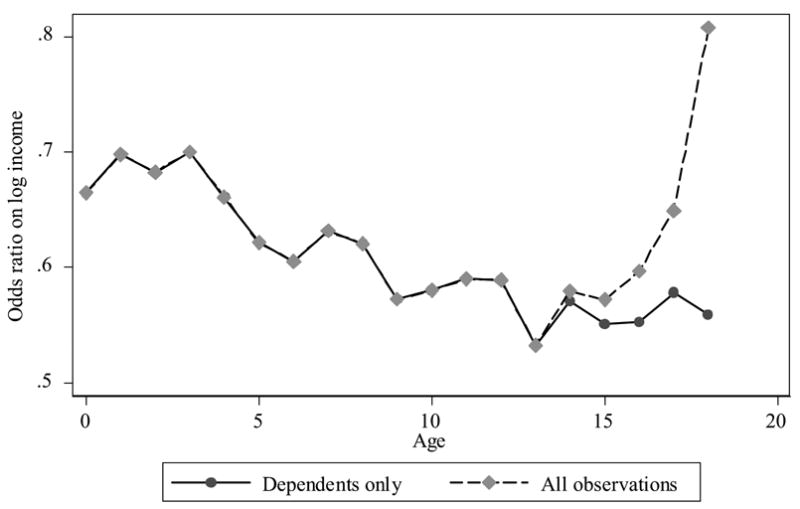
Note: Each point represents the OR on log income from logistic regressions estimated separately for each year of age. The dependent variable equals 1 if the child is in fair/poor health, 0 otherwise. Odds ratios are adjusted for race, sex, and survey year. All specifications are weighted using sampling weights.