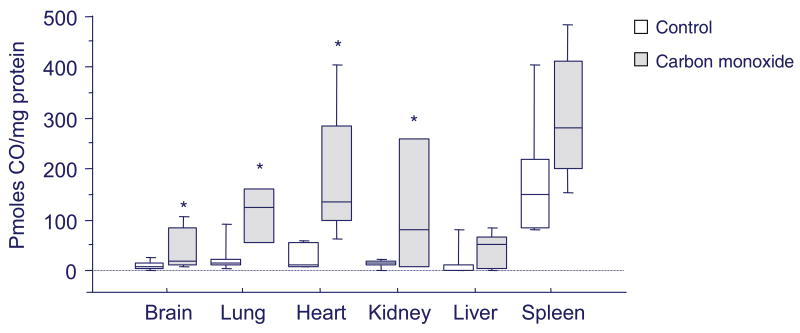
Figure 2.
Box plot of average cellular CO concentrations in different organs in mice. The mice were either air controls or had received one hour of CO inhalation at 500 ppm to achieve blood carboxyhemoglobin levels of ∼25%. One hour later, after euthanasia, tissues were harvested after perfusion of the vascular system with phosphate buffered saline (pH 7.4) to remove the hemoglobin. CO measurements were made in tissue homogenates using reduction gas chromatography as reported in references 44-46. The boxes represent the middle quartiles and the bars are the data ranges for 5 to 10 mice per tissue. Basal physiological CO levels are low, except for the spleen, but demonstrate significant intra- and inter-organ variability. CO exposure at the mouse's injury threshold increases cellular CO concentration by 4 to 10 fold; significant by ANOVA in all organs except the liver and the spleen (asterisks indicate P<0.05).

