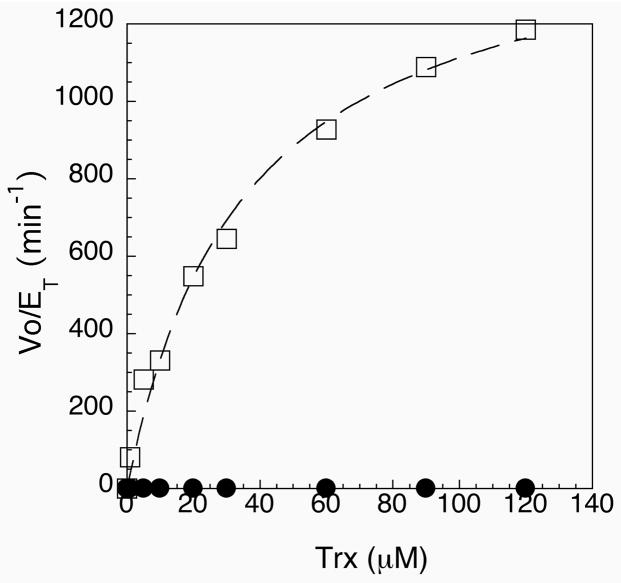
Figure 7.
Michaelis-Menten plot of Vo/ET vs. thioredoxin concentration for semisynthetic enzyme (open squares) and the Sec489Cys mutant (closed circles). Both curves could be fitted to a hyperbolic plot. Values of kcat and Km were obtained from the curve fit and are listed in Table 2.

