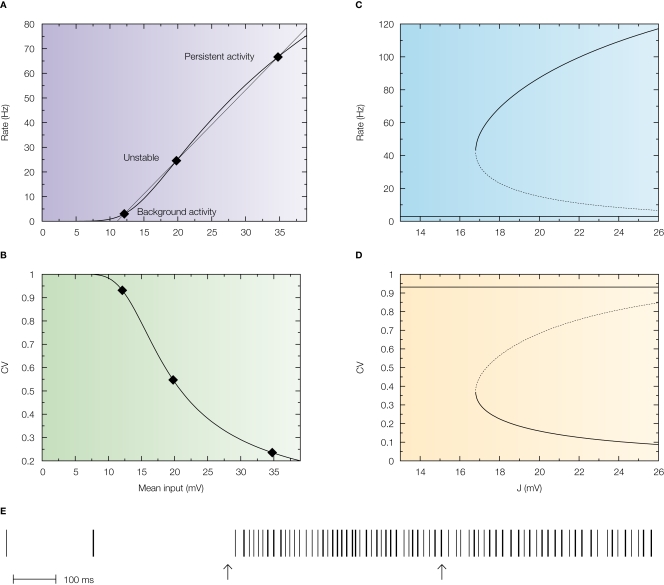
Figure 4.
Standard attractor network models produce highly regular persistent activity. Mean firing rate and CV of a population of excitatory leaky integrate-and-fire neurons with low reset (10 mV below threshold) connected by linear excitatory synapses (see Barbieri and Brunel, 2007 for more details). (A) f-I curve (firing rate of a single LIF neuron as a function of mean input). The intersections between the f-I curve (thick line) of the LIF neuron and the straight line (thin line) correspond to solutions of the mean-field equation, shown by diamonds, for a particular value of the synaptic efficacy. The three solutions correspond to the background activity state (stable), the limit of the basin of attraction (unstable) and the persistent activity state (stable). (B) CV-I curve (CV of a single LIF neuron as a function of mean input). Diamonds: Values of the CV for the three states shown in (A). (C) Bifurcation diagram showing firing rate of the excitatory network as a function of synaptic strength J. The background activity corresponds to the horizontal curve (lowest branch), the dotted curve (intermediate branch) is the boundary of the basin of attraction and the black curve (highest branch) represents the evolution of the persistent activity. (D) Bifurcation diagram showing how the CV depends on J: the persistent activity (black curve, lowest branch) has a CV which is well below the CV of the background activity (highest branch, red curve) for all values of J. (E) Spike train of one of the cells of the network (simulation of a network of 1000 neurons). Arrows indicate beginning and end of presentation of the stimulus, so the second arrow indicates the beginning of the delay period. Note the high regularity of the spike train in the delay period.

