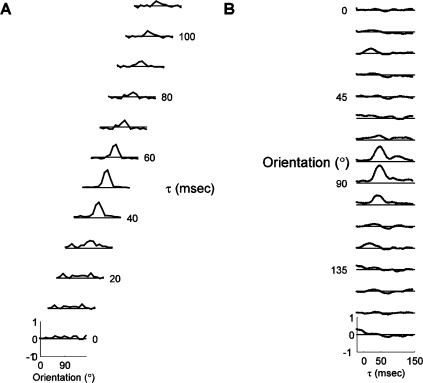
Figure 2.
Example of orientation dynamics. (A). A series of tuning curves taken at τs ranging between 15 and 125 ms after stimulus onset, as indicated to the right of each plot. The height of the tuning curves at each orientation represents the normalized probability that a spike was fired, plotted between −1 and 1, as indicated by the scale for the bottom curve. The solid line represents zero. (B). The timecourse of response for each orientation, from τ = −20 to τ = 145. The vertical scale and the position of the reference lines are identical to those in panel A.

