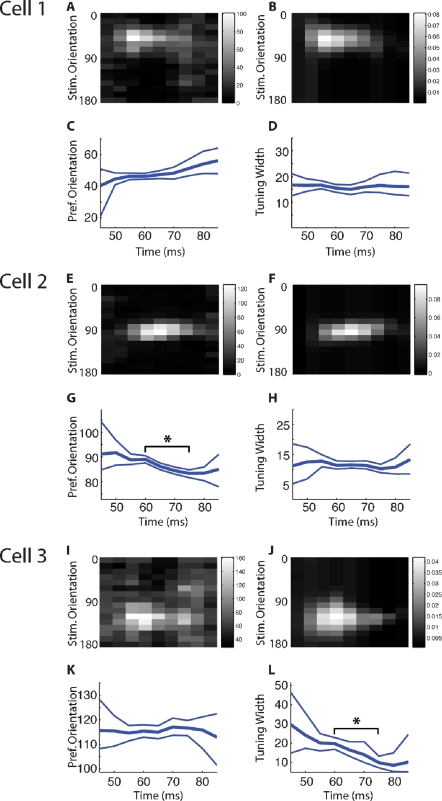
Figure 4.
Bayesian model fitting results for three example cells. A–D. Results from a cell which does not show evidence for a shift in either preferred orientation or tuning width. (A) The stimulus-triggered average response of the cell to stimuli of different orientations. The values shown indicate the total number of spikes which were observed to follow each stimulus orientation by a particular time lag (binned at 5 ms). (B) The expected response of the cell, as a function of stimulus orientation and time lag, as estimated by the Bayesian model fitting procedure. Plotted values indicate the estimated change in firing rate that is induced by each stimulus orientation at a particular time lag. (C) The time course of the preferred orientation parameter of the Bayesian model, showing the expected value (thick line) and 95% error margins (thin lines). (D) The time course of the tuning width parameter of the Bayesian model, again showing the expected value and 95% error margins at each time lag. (E-H) A cell which undergoes a shift in preferred orientation (in G) over the time course of its response; conventions as in (A-D). (I-L) A cell which sharpens its tuning (in L) over the time course of its response; conventions as in (A-D).

