
Fig. 4.
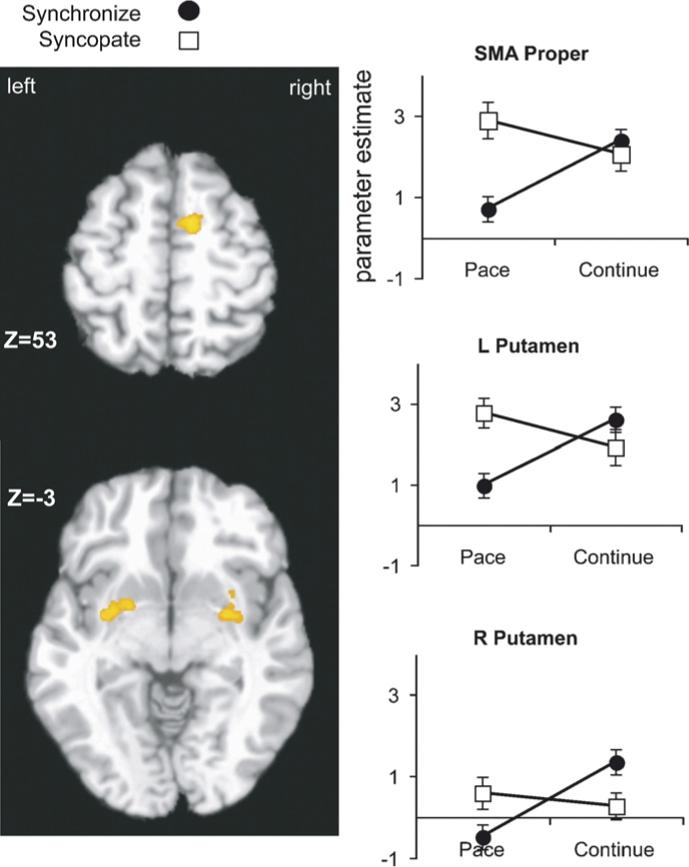
Cortical and subcortical brain regions demonstrating a Pattern × Task interaction are shown in color overlaid on selected slices of a canonical brain in the coordinate space of Tailarach and Tournoux. Plots on the right show the mean (across subject) parameter estimates (Beta weight for peak voxel in the cluster) from the two pacing conditions (synchronize: black circle; syncopate: white square) during both pacing (left) and continuation (right) phases. Error bars depict the standard error. From these plots it is evident that the interaction arises because of the initial difference between syncopate and synchronize observed during pacing. During continuation, these differences are no longer observed as activity converges to an intermediate level. Areas identified are SMA proper, and bilateral putamen of the basal ganglia.