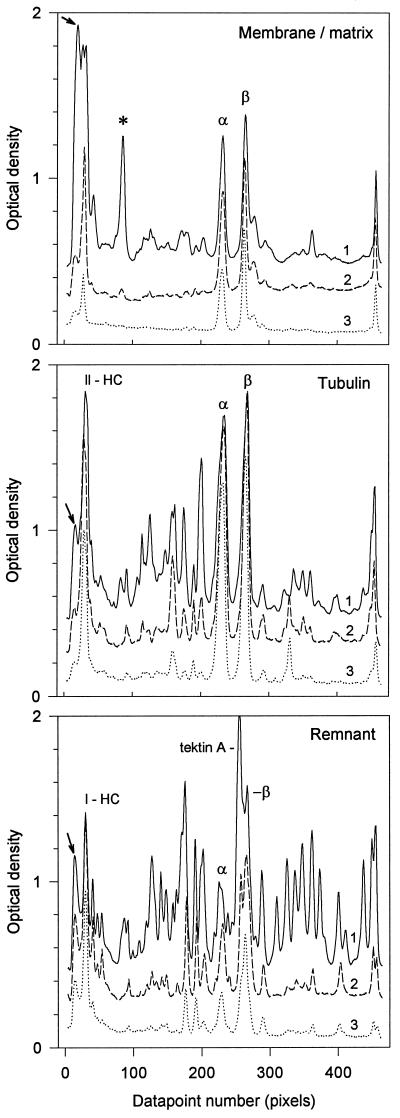
Figure 4.
Comparative densitometry of the 3H-fluorogram of the membrane/matrix, tubulin, and remnant fractions from Figure 3. The traces in each panel compare the designated fractions from the pulse-chase-labeled first (1), second (2), and third (3) regenerations. The data have been normalized for sample-loading differences, and traces 1 and 2 have been displaced vertically by 0.40 and 0.20 OD units, respectively, to avoid intersection. Peak designations correspond to the band designations of Figure 3. The arrows (extreme left) mark material barely penetrating the top of each gel.

