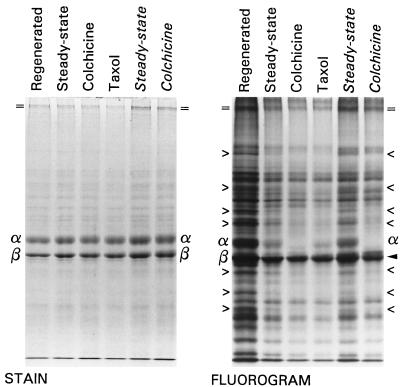
Figure 6.
SDS-PAGE and 3H fluorographic analysis of ciliary axonemes from parallel cultures of Regenerated, Steady-state control, and 1 mM Colchicine- or 10 μM Taxol-treated late-gastrula stage embryos and from Steady-state control and 1 mM Colchicine-treated midgastrula stage embryos. Left panel: Coomassie blue-stained gel; right panel: fluorogram of the same gel. The labeling patterns are similar between control and either colchicine or taxol-treated conditions, but both drugs cause similar diminution of label in certain proteins. Designations as in Figures 3 and 5; “> and <” mark the same proteins as Figure 5.

