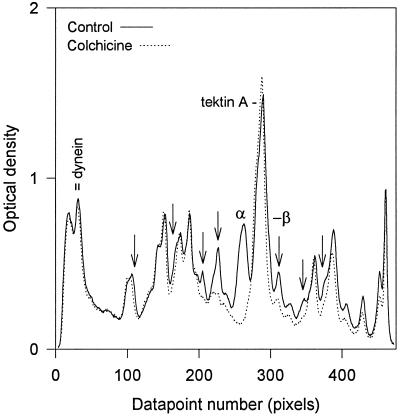
Figure 7.
Comparative densitometry demonstrates stoichiometric labeling of most ciliary proteins despite colchicine inhibition of tubulin synthesis. The final two lanes of Figure 5 were scanned, normalized by a factor of 1.30 for the difference in total nontubulin counts, and plotted together. The arrows designate the proteins whose labeling was diminished by colchicine treatment, as noted in Figure 5.

