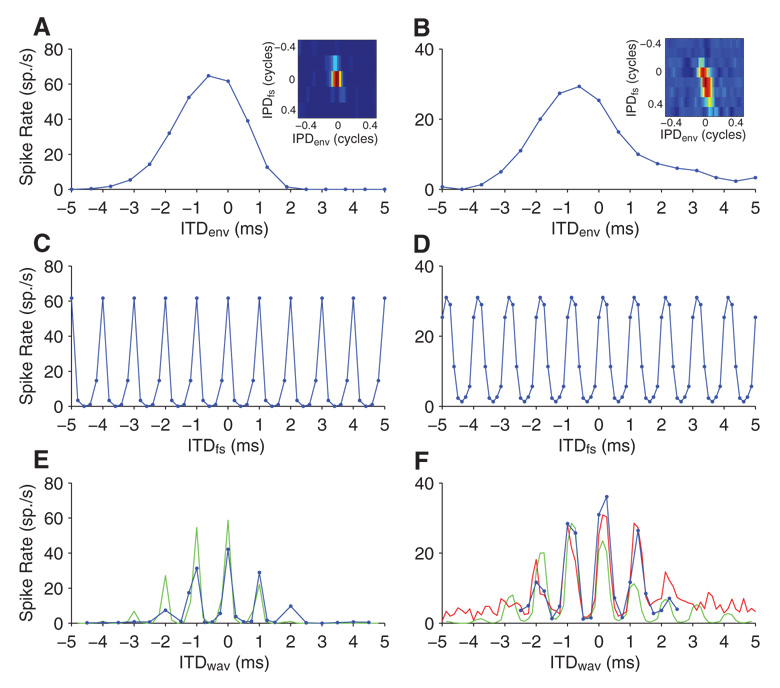
FIG. 10.
Sensitivity to ITD in the whole waveform for 2 neurons using a 1,000-pps, 40-Hz AM pulse train. Left: neuron is the same neuron as in Fig. 9. A and B: ITDenv tuning for ITDfs fixed at 0. Insets: joint ITDenv-ITDfs tuning functions. C and D: ITDfs tuning for ITDenv fixed at 0. E and F: tuning to ITD in the whole waveform (ITDwav). Blue points are direct measurements, green lines show predictions of ITDwav tuning from multiplication of ITDenv and ITDfs tuning curves, and the red line (F only) shows predictions of ITDwav tuning from resampling the joint ITDenv-ITDfs tuning function.

