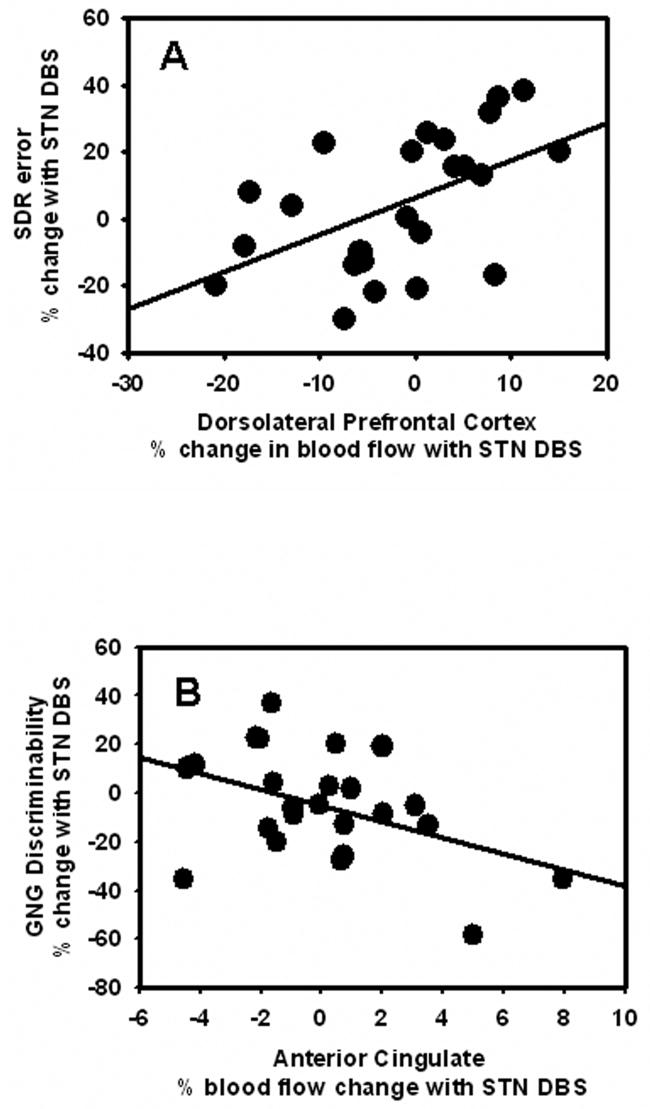
Figure 2.
Scatterplots showing the significant correlations between (A) change in DLPFC blood flow and change in WM, as indicated by SDR errors (larger numbers reflect decreased performance with stimulation), and (B) change in ACC blood flow and change in RI, as indicated by GNG discriminability (larger numbers reflect improved performance with stimulation). Both correlations indicate that stimulation-induced decreased cognitive control performance is associated with stimulation-induced increased blood flow responses.

